Tier: Really Hoping Lottery Reform Doesn’t Go Through
30. Chicago Bulls
Key Stat: 6.3 VORP
In 2016-17, Jimmy Butler ranked 5th in the NBA in VORP (Value Over Replacement Player) with 6.3. Amazingly, since I initially wrote the Bulls preview, they’ve actually gotten worse. With Butler gone, the Bulls best player by 16-17 VORP was set to be Dwyane Wade, but with Wade bought out, that honor goes to Nikola Mirotic--Mirotic tied for 107th in the NBA with a total of 1. The Bulls now boast the NBA’s worst best player. Not only do the Bulls have the league’s worst best player, but they lack depth, have an inept and impotent coach, and dysfunctional management; there is absolutely no way in which the Bulls could reasonably hope to fill the Butler-sized void in production. The Bulls are a dumpster fire. On the bright side, though, Luka Doncic looked absolutely incredible for the Slovenian national team recently.
29. Phoenix Suns
Key Stat: 42.3% FG% (Devin Booker)
Some view Devin Booker as one of the league’s brightest young stars destined to be a scorer in the mold of prime Ray Allen. Some believe Booker took a massive leap in his second year as a pro, because they see his PPG increased from 13.8 to a gaudy 22.1. Booker is an exciting young player--don’t get me wrong--but let’s address what actually happened in Phoenix last year. Booker shot...a lot. That’s all he did differently (as a scorer) in between his rookie and sophomore campaigns. In fact, his 2016-17 FG% of 42.3% was identical to that of his rookie year. More importantly, his True Shooting %, which accounts for threes and free throws and is a far better measure of efficiency than FG% actually declined from 53.5% to 53.1%--both marks comfortably below the league average of 55%. The major difference for 16-17 Booker vs. 15-16? 6.9 FGA per game. Booker took 60.5% more shots per game and scored 60.1% more points per game; “his improvement” was merely an increase in volume. Booker’s career is off to a really nice start, and he’s going to be an excellent player, but until the face of Phoenix’s franchise actually improves, the team will be going through the motions waiting for lottery night.
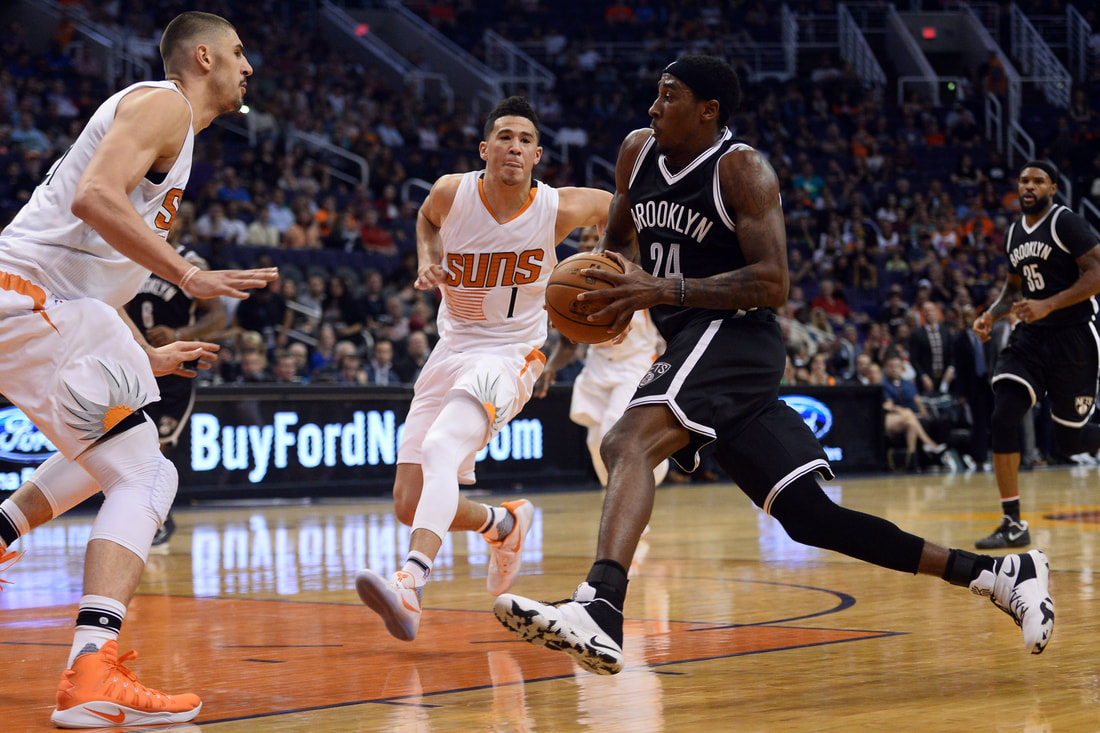
28. Brooklyn Nets
Key Stat: -4.2 NetRTG
While Brook Lopez was on the floor last year, the Nets were bad, running a -4.2 NetRTG, meaning that every 100 possessions, they were outscored by an average of 4.2 points. As a season mark, that would have been good for 25th in the Association, unambiguously not good. However, when Lopez took to the bench, things really went awry in Brooklyn. With Lopez off the floor, the Nets were outscored by 9.2 points per-100, which was the worst mark of any Net while he was off the floor. The Los Angeles Lakers had the worst NetRTG in the NBA last year, checking in at -7.2. The Nets minus Lopez were a full two points worse per-100 than the worst team in the league! For context, the Blazers, a playoff team in the West, ranked 15th in NetRTG last year. Two points per-100 was the differential between the Blazers and 22nd ranked Detroit, a team that finished outside the playoff picture in the lowly East. In the wake of the Celtics jettisoning the 2018 Nets first round pick in the Kyrie-Isaiah trade, some have jumped on the idea of the Nets significantly improving. In reality, the Nets lost their best player, a true impact player, and the Cavs can expect a very nice pick coming their way.
27. New York Knicks
Key Stat: 5.4 points per-100 possessions
In 2016-17 the Knicks had a NetRTG of -3.1 with Kristaps Porzingis on the floor. But let’s look a little deeper and split Porzingis’ playing time into two categories: minutes played alongside Carmelo Anthony and those played in absence of the polarizing scorer. When Porzingis played with Anthony, the Knicks were bad, posting a NetRTG of -5.1, which would have been good for 26th in the NBA last year. However, remove Anthony from the equation and the Knicks were surprisingly mediocre, which was likely a function of the precipitous decline Anthony has experienced over the last two years. Long unfairly cast as nothing but an inefficient, no-defense chucker, Anthony, whether due to declining skill or declining will, has become just that. Hard as it is to accept, there’s a great deal of evidence to suggest that Anthony is no longer a particularly positive player, or at least he wasn’t in the toxic New York environment. With Porzingis on the floor and Anthony on the bench, the Knicks actually posted a positive NetRTG of 0.3 (a differential of 5.4 points per-100), which would have put them on par with the Hornets for 12th in the league. Through all the drama and lack of on-court success, it had become abundantly clear that Carmelo Anthony and the Knicks needed a divorce, and perhaps the split will even be to the benefit of the team’s best player and the overall on-court product.
26. Orlando Magic
Key Stat: 24 expected wins
Using a team’s point differential, an “expected” win-loss record can be calculated. Given the natural variance involved in close games, the purpose of the expected win-loss is to remove some of the luck involved in close games. Typically, a team’s actual win-loss record would approximately match its expected win-loss. When there is a large margin between the two values, the team is generally considered to have either over- or under-performed in an unsustainable manner. Last year’s Orlando Magic won a measly 29 games, good for 6th-worst in the NBA. However, the Magic grossly overperformed their point differential, and thus, their expected record. The Magic’s expected record was 24-58, the tied for the worst in the Association. Maybe Aaron Gordon or Elfrid Payton makes a major leap. Maybe Jonathan Isaac is an immediate impact player. But more likely than not, the Magic are in for some nasty regression, and should only avoid being the worst team in the league because of the ineptitude of the above teams.
All stats courtesy of basketball-reference.com unless otherwise noted
Key Stat: 6.3 VORP
In 2016-17, Jimmy Butler ranked 5th in the NBA in VORP (Value Over Replacement Player) with 6.3. Amazingly, since I initially wrote the Bulls preview, they’ve actually gotten worse. With Butler gone, the Bulls best player by 16-17 VORP was set to be Dwyane Wade, but with Wade bought out, that honor goes to Nikola Mirotic--Mirotic tied for 107th in the NBA with a total of 1. The Bulls now boast the NBA’s worst best player. Not only do the Bulls have the league’s worst best player, but they lack depth, have an inept and impotent coach, and dysfunctional management; there is absolutely no way in which the Bulls could reasonably hope to fill the Butler-sized void in production. The Bulls are a dumpster fire. On the bright side, though, Luka Doncic looked absolutely incredible for the Slovenian national team recently.
29. Phoenix Suns
Key Stat: 42.3% FG% (Devin Booker)
Some view Devin Booker as one of the league’s brightest young stars destined to be a scorer in the mold of prime Ray Allen. Some believe Booker took a massive leap in his second year as a pro, because they see his PPG increased from 13.8 to a gaudy 22.1. Booker is an exciting young player--don’t get me wrong--but let’s address what actually happened in Phoenix last year. Booker shot...a lot. That’s all he did differently (as a scorer) in between his rookie and sophomore campaigns. In fact, his 2016-17 FG% of 42.3% was identical to that of his rookie year. More importantly, his True Shooting %, which accounts for threes and free throws and is a far better measure of efficiency than FG% actually declined from 53.5% to 53.1%--both marks comfortably below the league average of 55%. The major difference for 16-17 Booker vs. 15-16? 6.9 FGA per game. Booker took 60.5% more shots per game and scored 60.1% more points per game; “his improvement” was merely an increase in volume. Booker’s career is off to a really nice start, and he’s going to be an excellent player, but until the face of Phoenix’s franchise actually improves, the team will be going through the motions waiting for lottery night.
28. Brooklyn Nets
Key Stat: -4.2 NetRTG
While Brook Lopez was on the floor last year, the Nets were bad, running a -4.2 NetRTG, meaning that every 100 possessions, they were outscored by an average of 4.2 points. As a season mark, that would have been good for 25th in the Association, unambiguously not good. However, when Lopez took to the bench, things really went awry in Brooklyn. With Lopez off the floor, the Nets were outscored by 9.2 points per-100, which was the worst mark of any Net while he was off the floor. The Los Angeles Lakers had the worst NetRTG in the NBA last year, checking in at -7.2. The Nets minus Lopez were a full two points worse per-100 than the worst team in the league! For context, the Blazers, a playoff team in the West, ranked 15th in NetRTG last year. Two points per-100 was the differential between the Blazers and 22nd ranked Detroit, a team that finished outside the playoff picture in the lowly East. In the wake of the Celtics jettisoning the 2018 Nets first round pick in the Kyrie-Isaiah trade, some have jumped on the idea of the Nets significantly improving. In reality, the Nets lost their best player, a true impact player, and the Cavs can expect a very nice pick coming their way.
27. New York Knicks
Key Stat: 5.4 points per-100 possessions
In 2016-17 the Knicks had a NetRTG of -3.1 with Kristaps Porzingis on the floor. But let’s look a little deeper and split Porzingis’ playing time into two categories: minutes played alongside Carmelo Anthony and those played in absence of the polarizing scorer. When Porzingis played with Anthony, the Knicks were bad, posting a NetRTG of -5.1, which would have been good for 26th in the NBA last year. However, remove Anthony from the equation and the Knicks were surprisingly mediocre, which was likely a function of the precipitous decline Anthony has experienced over the last two years. Long unfairly cast as nothing but an inefficient, no-defense chucker, Anthony, whether due to declining skill or declining will, has become just that. Hard as it is to accept, there’s a great deal of evidence to suggest that Anthony is no longer a particularly positive player, or at least he wasn’t in the toxic New York environment. With Porzingis on the floor and Anthony on the bench, the Knicks actually posted a positive NetRTG of 0.3 (a differential of 5.4 points per-100), which would have put them on par with the Hornets for 12th in the league. Through all the drama and lack of on-court success, it had become abundantly clear that Carmelo Anthony and the Knicks needed a divorce, and perhaps the split will even be to the benefit of the team’s best player and the overall on-court product.
26. Orlando Magic
Key Stat: 24 expected wins
Using a team’s point differential, an “expected” win-loss record can be calculated. Given the natural variance involved in close games, the purpose of the expected win-loss is to remove some of the luck involved in close games. Typically, a team’s actual win-loss record would approximately match its expected win-loss. When there is a large margin between the two values, the team is generally considered to have either over- or under-performed in an unsustainable manner. Last year’s Orlando Magic won a measly 29 games, good for 6th-worst in the NBA. However, the Magic grossly overperformed their point differential, and thus, their expected record. The Magic’s expected record was 24-58, the tied for the worst in the Association. Maybe Aaron Gordon or Elfrid Payton makes a major leap. Maybe Jonathan Isaac is an immediate impact player. But more likely than not, the Magic are in for some nasty regression, and should only avoid being the worst team in the league because of the ineptitude of the above teams.
All stats courtesy of basketball-reference.com unless otherwise noted
