By Jack Friedman
Introduction
On July 7, 2016, the basketball world underwent a game-changing shake-up. It was on this day that All-Star regular Kevin Durant officially signed with the Golden State Warriors. This signing was unlike any other in recent memory. Sure, we had seen the formation of Boston’s Big Three in the summer of 2007 and LeBron’s “Decision” in 2010, but never had we seen a player as good as Kevin Durant go to a team already as good as Golden State.
From an analytical perspective, LeBron was the owner of 18.5 Win Shares and a 10.9 Value Over Replacement Player —both of which led the league—during his final season of his first stint in Cleveland, while Durant sported 14.5 Win Shares and a 6.4 Value Over Replacement Player—though not as high as LeBron’s figures, still very impressive. The main difference between the two lies in the previous success of the teams they decided to join. The 2010 Miami Heat finished with a record of 47-35, a respectably good record leading to a playoff berth with Dwayne Wade at the helm. The 2016 Warriors, however, were a historically good team. They had just broken the record for wins in a single season, finishing 73-9, and just missed out on the Larry O’Brien Trophy with a game 7 defeat to Cleveland in The Finals.
Durant’s move, more than anything else, began to call into question the issue of parity in the NBA. Parity can be loosely defined, for the purposes of this article, as the equality of talent distribution across all teams in the league, such that the gap between the “best” team and the “worst” team is relatively small when parity is high, and that in any given matchup between two teams, a winner cannot be easily predicted based on previous performance. Before Durant left Oklahoma City, parity was starting to become an issue facing the NBA. A team had just finished with the most wins in a single season in league history, and, likely the issue more concerning to the league, the Finals matchup was the same for the second year in a row. The NBA was starting to feel like a two horse race between Cleveland and Golden State, and that the unpredictability of the league was starting to disappear. The Kevin Durant signing after the second consecutive matchup of the perennial powerhouses in the Finals only made matters worse. It had many, including me, doubting how the league could be interesting with the championship favorite only becoming more favorable.
During the season, the Durant move loomed over me like a dark cloud. As a follower of the Blazers, the Warriors’ presence always became an answer to any question as the trade deadline approached about who we should or should not go after, as, no matter what we (or anyone else for that matter) did, we couldn’t really contend with Golden State. However, I decided that, at a certain point, this statement would not be true, and that any team’s odds of winning the title could be increased with the acquisition of a star player or players, just as Golden State had done the summer before.
The conundrum of beating the Golden State Warriors, (and, to an extent, of making basketball as exciting as it once was) led me to embark on this investigation of winning and championships, and how the two correlate. The goal of the project is to determine how much acquiring talent improves a team’s chances to win in the NBA, if at all, by using statistical analyses of the data of past seasons, and by providing examples of scenarios in which it did work and others where it did not. The main mechanism for accomplishing this is by creating a logarithmic formula to determine the likelihood of winning a championship at any given regular season win total.
Methods
The first step in this process was to define how I would evaluate a team’s success. For the purposes of this investigation, I needed to treat teams as a sum of their individual players, so that I could easily evaluate how moving players via trade or signing affected the team as a whole. While this process does have some limitations, especially using the example of the Kevin Durant signing, it seemed like the most logical and comprehensive means of accomplishing the goal of the study. This philosophy of evaluation led to the selection of the two main metrics used in this study: Win Shares and Value Over Replacement Player.
Wins Shares (WS) is a statistical measure to determine how many wins a player on a given team is responsible for as part of the total number of wins for a team. By adding the WS of all the players on a given team over the course of a season, a team’s record can be theoretically determined. WS was initially devised by the father of baseball’s statistical revolution Bill James in order to determine a player’s value to a baseball team, and was later adapted to be used for basketball. In this project, I used the WS data provided by Basketball Reference, using their adaptation of the Bill James model.
Value Over Replacement Player (VORP) is similar to WS in evaluating an individual’s worth to their team, but differs in that it compares their value to a theoretical “replacement player” from either outside a team’s normal rotation or from free agency. For context, players with a VORP of 0 (or replacement-level players) include names like Derrick Rose and Kosta Koufos, based on their 2016-2017 performances. The VORP a player provides can be converted into a win metric with simple calculation (per Basketball Reference), and can be added up to project a team’s win total. While different in method to WS, VORP provides a similar output, and serves as a good way to mitigate deviation based on a statistical anomaly. Like WS, VORP comes from the basis of a baseball metric. VORP is initially calculated as a rate independent of minutes played, called Box Plus-Minus (BPM), and then converted into the usage dependent number seen in VORP.
I gathered data for these two metrics for all the NBA seasons dating back to the 1973-74 season, the earliest both were available. Since both metrics are based on the statistics of individual players, the data for all players regarding WS and VORP totals had to be compiled and then organized by team. A sample for a single season (1985-86) is shown below; the highlighted columns indicated the win total based on the calculations using the statistics:
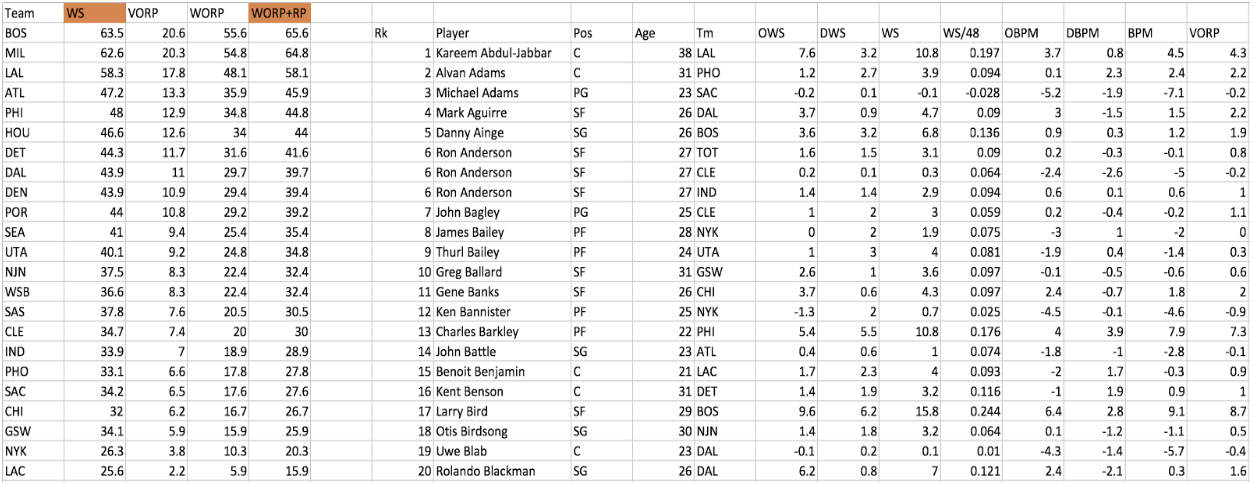
For each season, I calculated the gap for each team from the leader, going down the column. These gaps were used as the data points in determining the likelihood of a team winning a championship, and went into determining my eventual formula. To begin, my initial data point was with respect to the team that led the league in either WS or VORP. For both of these, the number of times the leader in the category went on to win the championship was divided by the total number of seasons analyzed. This gave an output of 44.19% for WS and 39.53% for VORP.
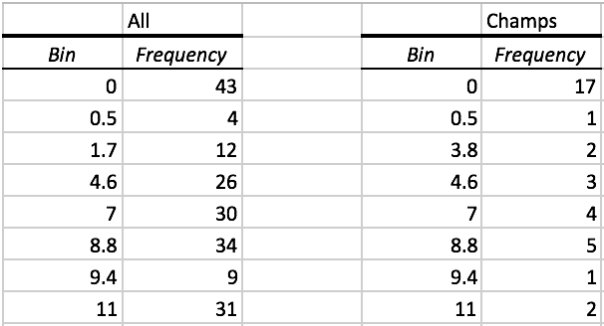
After this data point was established, the remaining data points were categorized into “bins.” The bins allow us to find probabilities of winning a championship based on past success of those in this given range. Just as the above calculation for the leaders determined the probability of winning a championship by leading WS or VORP during the regular season, the same is done with bins at increments along the range of data points. Bins are created by dividing the number of champions at a certain gap (under the “Champs” heading) by all the teams that have finished at that gap, regardless of if they won a championship or not (under the “All” heading). An example of bin creation for WS is shown below:
After this data point was established, the remaining data points were categorized into “bins.” The bins allow us to find probabilities of winning a championship based on past success of those in this given range. Just as the above calculation for the leaders determined the probability of winning a championship by leading WS or VORP during the regular season, the same is done with bins at increments along the range of data points. Bins are created by dividing the number of champions at a certain gap (under the “Champs” heading) by all the teams that have finished at that gap, regardless of if they won a championship or not (under the “All” heading). An example of bin creation for WS is shown below:
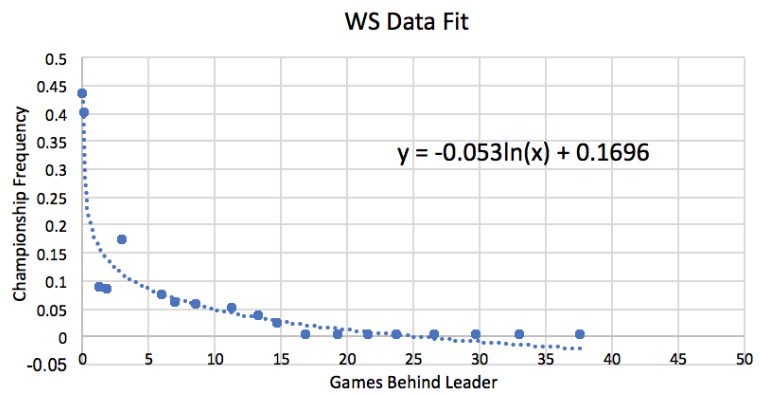
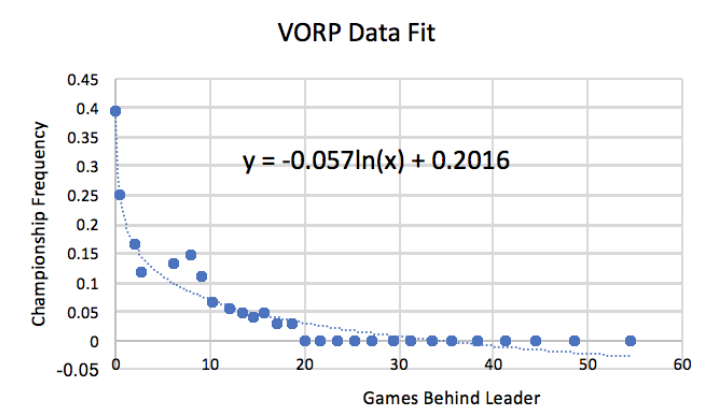
This percentage serves as a data point on the graph used in the eventual determination of the equation to model championship-winning likelihood. Each data point is weighted so that bins of different sizes are taken into account. These data points are then curve fit using a logarithmic function to determine the probability continuously from the leader. The fitted graphs and equations for WS and VORP are shown below:
These equations can now be used to determine whether player acquisitions are beneficial to the chances of winning a championship. Additionally, the equations can be used with past examples of trades and signings that agree or disagree with the models.
Case Applications
In order to test the validity of the model, we must apply it to existing cases. Below, I will evaluate several examples of high-profile acquisitions, and determine how well they fit with the model, and analyze the limitations and draw conclusions about the respective acquisitions. The first two cases I will examine fall in line with the model for the most part, while the final case shows limitations of the model. In this section, I will be using both WS and WS/48 (Win Shares per 48) to analyze trades and signings. WS/48 allows us to see how much a player contributes to a single win, and is thus more easily applied to players acquired midseason who don’t have a full season of data with a single team. Just as per game statistics are used to normalize number of points and rebounds, WS/48 normalizes WS in a similar manner. For example, Kareem Abdul-Jabbar is the all-time leader in both points and in WS due to the longevity of his career, whereas Michael Jordan is the all-time leader in both points per game and WS/48.
The first case I will examine is the one I presented in the introduction: the 2016 Kevin Durant signing. This application is quite simple mathematically. In the summer of 2016, the Warriors lost far less than they gained from Durant, as well as Zaza Pachulia and David West, among others. Just adding Durant’s 14.5 WS total from 2015-16 to the Warriors season total of 67.8 leaves the Warriors with more WS (82.3) than games (82) before accounting for the drop-off of losing players like Harrison Barnes. Despite this impossibility, it still serves its purpose from an analytics standpoint. The addition of Durant allows them to overtake first place from San Antonio and create a large gap in WS and VORP from themselves to the now-second place Spurs, not only reducing their own gap to zero, but also creating a higher disparity in the percentages from the model for all the other teams in the league. This addition raises the Warriors chance to win the championship, arbitrarily set to 43% when using the WS equation and 39% when using the VORP equation, and lowers everyone else’s chance of winning with the larger gap (which can be adjusted per 100% once a total percentage is determined based on all the teams’ WS or VORP gaps), hence the functionality of the model in saying that the Warriors are still the favorites with a 43% or 39% chance to win.
The next case we can look at is the New Orleans Pelicans’ acquisition of DeMarcus Cousins at the 2017 trade deadline. In the trade, the Pelicans received Cousins and Omri Casspi in exchange for Buddy Hield, Tyreke Evans, Langston Galloway, and the Pelicans’ 2017 first- and second-round picks. Overall this trade was hailed as a huge failure for GM Vlade Divac and the Kings organization as a whole. With the Kings, Cousins was at about .152 WS/48 and Casspi had .043 WS/48. For the Pelicans, the three traded players combined for .124 WS/48. Adding in a pick that comes in at number 10, and the fact that they are also selecting 5th, the Kings don’t seem to be too far off in terms of trade value from the WS point of view. As for the Pelicans, they were able to add .195 WS/48 between the 2 players they acquired. Adding this value to their total from the 2015-16 season, this leaves the Pelicans at an increase from 31.1 WS to 36.9 WS. Subtracting this from the leader in WS (San Antonio with 69.1), this leaves their gap reduced from 38.0 to 32.2. Per the model, this gap reduction does not increase their chances at all, and still leaves them below the 0% cutoff. This is massive in terms of the implications of this deal, as far as trades in general go. Adding a top-tier center in Cousins to the stallwort that is Anthony Davis in New Orleans should logically help their title chances at least a little. This lack of improvement is yet another example of the NBA’s parity issue that is ever present in today’s game. Statistically, this is a result of the x-intercept of the model at approximately (24.55,0), meaning that any team at or below that figure has no chance to win a championship. This makes sense logically, as a team that far back from the leader will rarely (if ever) make the playoffs to begin with (which the Pelicans did not). As a result, this trade did not, in both theory and practice, help the Pelicans in the short term. The acquisition does, however, set them up well for success in the future, if, and only if, Cousins chooses to resign in New Orleans.
One flaw of the model is exposed in the Portland Trail Blazers acquisition of Jusuf Nurkic at the trade deadline. In this deal, the Blazers received Nurkic and a first-round pick (originally belonging to Memphis), in exchange for Mason Plumlee and the Blazers’ second-round pick. At the time of completion, this trade seemed to be relatively fair and helpful to both parties, as the Blazers got the defensive presence they needed inside while the Nuggets got a backup center that more closely fit the mold of rising star Nikola Jokic. And as division rivals both contending for the 8th seed in the West last season, the trade likely would not have been completed had both parties not been happy with what they received. Shortly after the completion of the trade, however, it became all too apparent which team came out on top. Nurkic and the Blazers steamrolled their opponents in March, finishing the month 13-3, with one of the three losses coming on a missed out of bounds call against the Wizards just seconds before a buzzer beater was scored. The main moral of this trade was that Nurkic began to perform at a different level after joining the Blazers, and thus made the trade more valuable to them. In Denver, his WS/48 for the season was .034, but after joining the Blazers it skyrocketed to .116. Across an 82-game season, that comes out to 5.9 WS, on par with players like Enes Kanter and George Hill, despite his below-average minutes per game based on his acclimation to more playing time once in Portland. Additionally, Nurkic’s presence was felt beyond the scope of this statistic. Looking at WS and WS/48, the Blazers lost more than they gained, even with Nurkic breaking out. Plumlee was worth .146 WS/48 to the Blazers, .030 WS/48 more than Nurkic. Yet, the Blazers still went on that incredible run and found their way into the playoffs over Denver. Examples like this one show that sometimes a team’s missing piece may be worth more than stats can show.
Future Application
A final example we can look at involves forecasting outcomes of next season based on trades and free agent signings. One of the most notable offseason moves occurred on June 30, 2017, when Paul George was traded from the Pacers to the Thunder for Victor Oladipo and Domantas Sabonis. In what is seemingly a completely lopsided deal favoring the Thunder (especially given the reported packages of Boston and Portland among others during the draft), the Pacers were largely looking to acquire anything they could ahead of George’s expected departure to the Los Angeles Lakers next summer, and were able accomplish that in a technical sense with this trade. Despite getting an established starter and a young prospect, the Pacers seemed to miss out on the bigger deals at their disposal on draft night. It was reported that the Blazers, for example, offered all three of their first round picks and a choice of any player on the roster other than Damian Lillard, C.J. McCollum, or Jusuf Nurkic. Though the value of draft picks goes beyond the scope of this investigation, it can be easily surmised that 3 first round draft picks and a player worth 4.2 WS and a VORP of 1.5 in Maurice Harkless are worth more than the combined 4.8 WS and VORP of -0.8 of Oladipo and Sabonis. As for Oklahoma City’s acquisition of George, it seems to be a fantastic trade to help them succeed. George adds a net 2.3 WS and 4.0 VORP to the Thunder, pushing them from 11th in WS and VORP to 10th in WS and 5th in VORP. In terms of their chances to win a championship, this pushes them from .16% to .70% in terms of WS, and from .20% to 2.44% in VORP. While this change seems inconsequential, this does represent a significant improvement. The fact that a 5th place team in terms of VORP only has 2.44% chance to win a title goes to show the real gap that the top teams possess over the rest of the league. All in all, George serves as a welcome addition to a team who finished 6th in the West and will more than likely improve their record, so long as George and Westbrook gel properly.
Conclusion
I think overall the model devised for this investigation serves as an interesting metaphor for talent acquisition: your team will only ever be as good as the gap between them and the best team. I believe this statement holds true in today’s NBA more than it has in many of the previous seasons in recent memory. Looking at teams in the West, bringing in talent like Jimmy Butler and Paul George will only help their causes so much as they battle for anything resemblant of relevance in a league dominated by a powerhouse with 4 All-Stars. So as talk of “super teams” increases, it feels like a must to have at least 3 All-Star-level players to even contend for a title, let alone make it to The Finals. In terms of VORP, the gap between the first and second place teams that exists now has not been seen since the likes of Jordan’s Bulls after the 1995-96 season. As it stands now, the issues of talent acquisition speak to the larger issue facing the league in terms of parity. There was a time that an All-Star acquisition at the deadline could transform a team from playoff material to a champion as was seen with Houston’s Clyde Drexler acquisition in 1995. In today’s league, adding a superstar to an MVP may only be enough to secure a second-round berth in the playoffs, especially given the still less than 1% chance to win (based on the WS model) after the acquisition, as we saw with Paul George. All of this boils down to a single truth in today’s NBA: unless you can build a team with at least 3 players of All-NBA caliber, you don’t have a prayer of contending. The disparity that the Warriors have created has fostered more super team building and less competition between all of the league’s team in favor of competition between a few of the league’s best teams. For as long as “super teams” are the norm, we will continue to see playoffs as brief and uneventful as this year’s for many seasons to come.
