It’s the Midsummer Classic, the highest-rated all-star game in sports; in just 24 hours the American League and National League will faceoff in the greatest nine-inning exhibition of the year. The best of the best will be there. Perennial favorites like Albert Pujols, Miguel Cabrera, and Prince Fielder, among others, made the cut yet again. Reigning MVP, Mike Trout, will be making his 4th consecutive appearance and 3rd straight start this year. Fellow superstars, Bryce Harper and Giancarlo Stanton, were each selected for their 3rd game as well. Josh Donaldson smashed the all-star vote record, receiving an unprecedented 14 million of them, and his 2nd straight appearance. 29 guys will be making just their first all-star appearance as well. It will certainly be an incredible night for baseball, and always an important one (the winning league receives home-field advantage in the World Series).
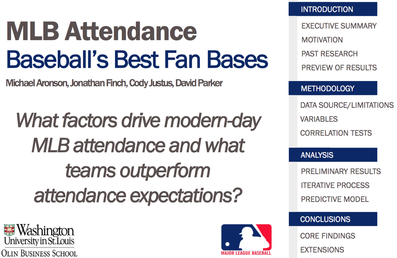
Download the article and view the data below:
Download the article and view the data below:
| article.docx |
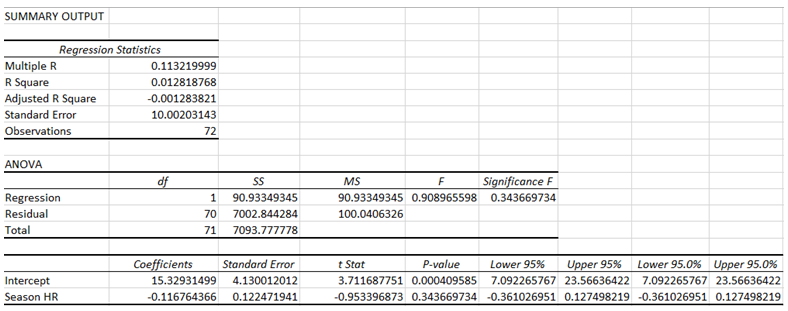
| sabermetrics.xlsx |