Introduction:
Now that there is only about one quarter left of the 2015 NBA season, analysts are trying to predict the next MVP winner. ESPN and Basketball References created models to rank the top MVP candidates. However, credible news sources like USA Today argue that it is impossible to not only create a model that can accurately predict the next MVP winner, but also generate a correlation significantly greater than 50%.
Analysts believe that there are too many unquantifiable variables that influence voters. Each player has their own narrative that appeals to voters differently. Over the past few years, one can accumulate a total of 1,250 points. However, this number changes depending on how many people vote from the media. The media ranks players from 1-6 and a greater weight is assigned to those who rank higher. For example, if a voter ranks Lebron James as number one and Kevin Love as six, Lebron James will receive 10 points while Love will only receive 1 point.
My research started by collecting data on NBA players going back to the 1994 season when Hakeem Olajuwon won the MVP. Michael Jordan and Karl Malone battled for the first place for three years until Shaquille O’Neal won in 2000. He almost became the first and only player to win the MVP unanimously, but one voter voted for Allen Iverson who finished 7th. The only other player to only lose one first place vote was Lebron James thirteen years later.
Results:
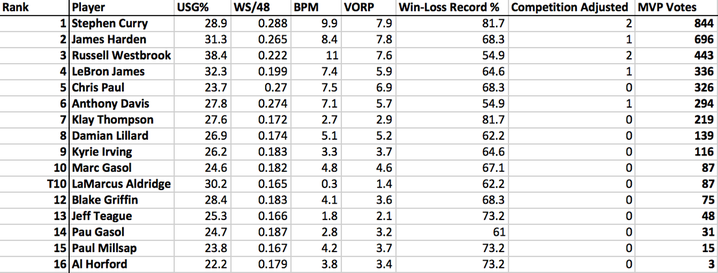
We predict that Stephen Curry will win the MVP with 844 votes with James Harden in second with 696 votes. Russell Westbrook, Lebron James, and Chris Paul will finish 3rd, 4th and 5th, respectively. While Chris Paul had a better season than Lebron James, we don’t believe that the media will vote in accordance with the statistics.
To run the model, I used SPSS to create an optimal model with backwards elimination as well as StatPlus in excel to generate a multiple linear regression model and residual plots of our independent variables. These variables consist of USG%, WS/48, BPM, VORP, Win-Loss Record and Competition.
The model as a whole is statistically significant with a p-level near zero. Also, we have an R-value of .83, an adjusted R Square of .67, and a Se/ybar of .92. Thus, it is accurate to conclude that we have a credible model that shows a moderately strong correlation between our independent variables and the number of MVP votes received.
Methodology:
I will explain my thought process when constructing this model starting at its inception to the final product. Initially, I collected data from basketball references and ESPN going back to 1994. I started experimenting with linear regressions but couldn’t find anything significant. There were two reasons for this. First, the population size wasn’t a normal distribution since it included every player instead of only players who received at least one vote. However, when I just looked at players with at least one vote, the model couldn’t accurately predict MVP votes due to high variations among players. Additionally, those who receive only one vote are mostly due to chance. It could be that a voter ranked a player sixth to create noise or perhaps they went to the same college. Second, the variables I was using were basic statistics ranging from points to rebounds to blocks. However, I soon realized that more advanced metrics had better results.
Instead of going back to the 1994 season, I only used data going back to the 2008 season and excluded the 2011 season. I wanted to go back to the 2008 season because voting and rules have changed prior to that year. I also had to change my data in the 2012 season because of the lock out. I also excluded the 2011 season because there were too many outliers in the data so the must fair way to handle it was to categorically remove the year. Lebron James finished third behind Derrick Rose and Dwight Howard even though his statistics were better. The reason he finished third was because everyone hated him after he left Cleveland. This is where the narrative can sometimes come into play. However, I do believe that a credible model can sufficiently predict MVP votes.
Now to talk specifically about the model I created. Each independent variable that I use is straightforward. I looked at a vast array of complicated and advanced metrics, but found the combination of USG%, WS per 48, BMP and VORP yield the best results. Also, I included a win-loss record and a competition variable. The competition variable rewards those who have a VORP AND WS per 48 that are 1.5 standard deviations greater than your average player who receives at least one MVP vote. I chose these variables because they had the greatest impact on the dependent variable of MVP votes, which I determined before including the competition variable. Players get a 1 for having either a VORP or WS per 48 1.5 standard deviations greater than the mean or 2 points for having both.
There are two things to note when creating the model. First, VORP and BMP have an extremely high multicollinearity. When I remove those variables, the model is slightly worse. I was able to conclude that by adding the two together, it makes the model more accurate. This can be due to over fitting or the advance metrics working together to show a player’s skills. Second, I had to create a multiplier to adjust the number of votes. The data might be slightly skewed because Lebron James wins almost every MVP with Durant typically at a close second. However, this year, there isn’t one player putting up similar numbers to MVP winners in the past six years. Adding a multiplier that looks at voting trends of the past six years, I was able to adjust the number of votes to accurately reflect historical media voters.
Now that there is only about one quarter left of the 2015 NBA season, analysts are trying to predict the next MVP winner. ESPN and Basketball References created models to rank the top MVP candidates. However, credible news sources like USA Today argue that it is impossible to not only create a model that can accurately predict the next MVP winner, but also generate a correlation significantly greater than 50%.
Analysts believe that there are too many unquantifiable variables that influence voters. Each player has their own narrative that appeals to voters differently. Over the past few years, one can accumulate a total of 1,250 points. However, this number changes depending on how many people vote from the media. The media ranks players from 1-6 and a greater weight is assigned to those who rank higher. For example, if a voter ranks Lebron James as number one and Kevin Love as six, Lebron James will receive 10 points while Love will only receive 1 point.
My research started by collecting data on NBA players going back to the 1994 season when Hakeem Olajuwon won the MVP. Michael Jordan and Karl Malone battled for the first place for three years until Shaquille O’Neal won in 2000. He almost became the first and only player to win the MVP unanimously, but one voter voted for Allen Iverson who finished 7th. The only other player to only lose one first place vote was Lebron James thirteen years later.
Results:
We predict that Stephen Curry will win the MVP with 844 votes with James Harden in second with 696 votes. Russell Westbrook, Lebron James, and Chris Paul will finish 3rd, 4th and 5th, respectively. While Chris Paul had a better season than Lebron James, we don’t believe that the media will vote in accordance with the statistics.
To run the model, I used SPSS to create an optimal model with backwards elimination as well as StatPlus in excel to generate a multiple linear regression model and residual plots of our independent variables. These variables consist of USG%, WS/48, BPM, VORP, Win-Loss Record and Competition.
The model as a whole is statistically significant with a p-level near zero. Also, we have an R-value of .83, an adjusted R Square of .67, and a Se/ybar of .92. Thus, it is accurate to conclude that we have a credible model that shows a moderately strong correlation between our independent variables and the number of MVP votes received.
Methodology:
I will explain my thought process when constructing this model starting at its inception to the final product. Initially, I collected data from basketball references and ESPN going back to 1994. I started experimenting with linear regressions but couldn’t find anything significant. There were two reasons for this. First, the population size wasn’t a normal distribution since it included every player instead of only players who received at least one vote. However, when I just looked at players with at least one vote, the model couldn’t accurately predict MVP votes due to high variations among players. Additionally, those who receive only one vote are mostly due to chance. It could be that a voter ranked a player sixth to create noise or perhaps they went to the same college. Second, the variables I was using were basic statistics ranging from points to rebounds to blocks. However, I soon realized that more advanced metrics had better results.
Instead of going back to the 1994 season, I only used data going back to the 2008 season and excluded the 2011 season. I wanted to go back to the 2008 season because voting and rules have changed prior to that year. I also had to change my data in the 2012 season because of the lock out. I also excluded the 2011 season because there were too many outliers in the data so the must fair way to handle it was to categorically remove the year. Lebron James finished third behind Derrick Rose and Dwight Howard even though his statistics were better. The reason he finished third was because everyone hated him after he left Cleveland. This is where the narrative can sometimes come into play. However, I do believe that a credible model can sufficiently predict MVP votes.
Now to talk specifically about the model I created. Each independent variable that I use is straightforward. I looked at a vast array of complicated and advanced metrics, but found the combination of USG%, WS per 48, BMP and VORP yield the best results. Also, I included a win-loss record and a competition variable. The competition variable rewards those who have a VORP AND WS per 48 that are 1.5 standard deviations greater than your average player who receives at least one MVP vote. I chose these variables because they had the greatest impact on the dependent variable of MVP votes, which I determined before including the competition variable. Players get a 1 for having either a VORP or WS per 48 1.5 standard deviations greater than the mean or 2 points for having both.
There are two things to note when creating the model. First, VORP and BMP have an extremely high multicollinearity. When I remove those variables, the model is slightly worse. I was able to conclude that by adding the two together, it makes the model more accurate. This can be due to over fitting or the advance metrics working together to show a player’s skills. Second, I had to create a multiplier to adjust the number of votes. The data might be slightly skewed because Lebron James wins almost every MVP with Durant typically at a close second. However, this year, there isn’t one player putting up similar numbers to MVP winners in the past six years. Adding a multiplier that looks at voting trends of the past six years, I was able to adjust the number of votes to accurately reflect historical media voters.
***The excel document can be manually edited using a Mac. If you have a PC, you can alter the tabs using data references to pull from online sources and set up macros to update automatically. If you have a Mac, all you have to do is update tabs that are highlighted in red. The document runs from right to left. Follow the instructions below:
1) Go to tab labeled “UPDATE Advance Stats”. Cell A1 has the link to the website which you will use to copy and paste data
2) Follow the same steps on “UPDATE Regular Stats” and “UPDATE Team Record”
3) Go to “Real Time Filtered”
a. Click Cell G1 on the filter icon.
b. Click Clear Filter
c. Click on Cell L1 on the filter icon.
d. Click Clear Filter
e. Click Cell G1 on the filter icon
f. Set greater than -.5
g. Click Cell L1 on the filter icon
h. Set greater than 0
i. Finally, copy and paste values into the “MVP Votes” tab
4) Go to “MVP Votes”
a. Click on the filter to have the MVP votes descend to see the final ranking
| nba_mvp_predictor_2014-15.xlsx |
