
Introduction:
The Flyweight division is currently the lightest division for male fighters in the UFC with an upper limit of 125 lb. It is also the home division to arguably the UFC’s most dominant pound-for-pound fighter, Demetrious “Mighty Mouse” Johnson, who is and has been the division’s first and only reigning champion since its creation in 2011. Due to the weight constraints of the relatively new division, the characteristics of its fighters are known to be comparatively more agile and flexible in between stand-up and on-ground transition or fighting. Therefore, it certainly has a unique style and pace, which is why this particular division was one of interest and chosen to be further explored.
Building the Regression:
Using data provided by the UFC website[1], I was able to input each fighter’s overall career statistics compiled over recorded fights in organized professional mixed martial arts. This may include but is not limited to their involvement in the UFC, DREAM, or WEC. However, the majority of the fights compiled are from the UFC, and the only records used to calculate the fighter’s win percentage was the UFC’s. This eliminates irregularities or regulations of other organizations that may not be representative of the UFC’s and more accurately depicts the fighter’s success within it. The mentioned statistics are listed and can be seen in the excel spreadsheet titled “Flyweight Data”.
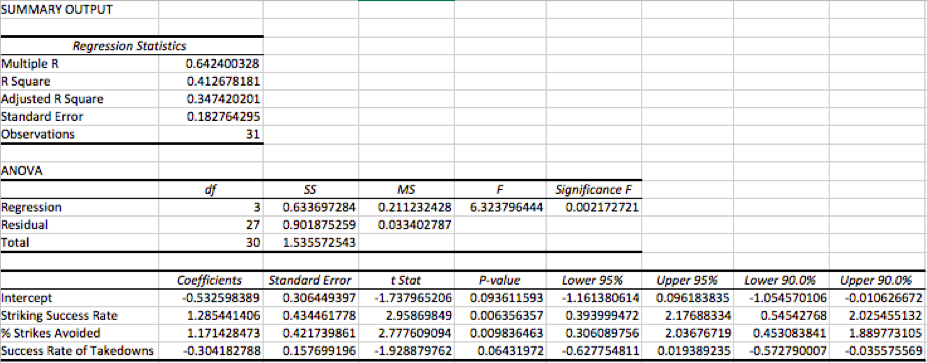
Next, I revised the data by eliminating statistically insignificant independent variables with comparatively higher p-values and the lowest coefficients. I suspected these factors were unnecessarily increasing the standard error and significant F value of the model. By continuing this process four times, I was able to create a statistically significant regression model with standard error and significant F values of 0.1828 and 0.0022, respectively. Two of the three independent variables are significant within a 95% confidence interval and the third within a 93% interval. The p-value of the intercept is satisfied within a 90% confidence interval which is why the model includes the upper and lower limit of 90%. The process of the revisions and selections of the independent variables can be seen on the excel document with each revision labeled “Revised 1, Revised 2, etc.”. The regression of each data set follows thereafter and is titled “Reg 1, Reg 2, etc.”
The “Best Model” was titled as such because further eliminating the variable with the highest p-value from that particular data set increased both the standard error and significant F values of the following regression. Therefore, it was decided to keep the three independent variables of Striking Success Rate, % Strikes Avoided, and Success Rate of Takedowns.
The Flyweight division is currently the lightest division for male fighters in the UFC with an upper limit of 125 lb. It is also the home division to arguably the UFC’s most dominant pound-for-pound fighter, Demetrious “Mighty Mouse” Johnson, who is and has been the division’s first and only reigning champion since its creation in 2011. Due to the weight constraints of the relatively new division, the characteristics of its fighters are known to be comparatively more agile and flexible in between stand-up and on-ground transition or fighting. Therefore, it certainly has a unique style and pace, which is why this particular division was one of interest and chosen to be further explored.
Building the Regression:
Using data provided by the UFC website[1], I was able to input each fighter’s overall career statistics compiled over recorded fights in organized professional mixed martial arts. This may include but is not limited to their involvement in the UFC, DREAM, or WEC. However, the majority of the fights compiled are from the UFC, and the only records used to calculate the fighter’s win percentage was the UFC’s. This eliminates irregularities or regulations of other organizations that may not be representative of the UFC’s and more accurately depicts the fighter’s success within it. The mentioned statistics are listed and can be seen in the excel spreadsheet titled “Flyweight Data”.
Next, I revised the data by eliminating statistically insignificant independent variables with comparatively higher p-values and the lowest coefficients. I suspected these factors were unnecessarily increasing the standard error and significant F value of the model. By continuing this process four times, I was able to create a statistically significant regression model with standard error and significant F values of 0.1828 and 0.0022, respectively. Two of the three independent variables are significant within a 95% confidence interval and the third within a 93% interval. The p-value of the intercept is satisfied within a 90% confidence interval which is why the model includes the upper and lower limit of 90%. The process of the revisions and selections of the independent variables can be seen on the excel document with each revision labeled “Revised 1, Revised 2, etc.”. The regression of each data set follows thereafter and is titled “Reg 1, Reg 2, etc.”
The “Best Model” was titled as such because further eliminating the variable with the highest p-value from that particular data set increased both the standard error and significant F values of the following regression. Therefore, it was decided to keep the three independent variables of Striking Success Rate, % Strikes Avoided, and Success Rate of Takedowns.
Interpretation:
Given the results of the best fit regression model shown above, the coefficients of 1.2854, 1.1714, and -0.3042 suggest the change in y, win percentage, given a change of 1 unit of x, in this case one percentage of either Striking Success Rate, % Strikes Avoided, or Success Rate of Takedowns. Oddly enough, there is a negative correlation of takedown success and win percentage. A pattern is further revealed about the detrimental effects of ground work and an emphasis on related techniques in relation to win percentage. This can be seen throughout the elimination process of the independent variables with negative coefficients for factors such as # of passes, sweeps, and % Takedowns Avoided. Further research on other divisions may help place the Flyweight division’s take on ground fighting in context, but the advantages of a dominant stand-up striking game are made clear through this analysis.
Limitations:
With the multiple R being 0.6424, it can be stated that the number of observations, 31, could be increased to create a more convincing model. This however is subject to the limited data given by the UFC and the total number of fighters active within the division. Ideally, each fighter would have 30+ recorded fights to display a more accurate representation of their abilities within the Octagon and the number of active Flyweight fighters would be higher, but this is not the case. Therefore, the number of observations must be accounted for, in addition to the number of fights each fighter accumulated during their professional MMA career ranging from 2 to 21.
[1] http://www.ufc.com/fighter/Weight_Class/Flyweight
| flyweight_analysis_steffan_seok.xlsx |
